Reports
Reports help you monitor your team performance, measure support load, and track customers' happiness.
Your reports depend on the time zone set in your user profile, whether in the admin panel or user portal.

If you select "Detect Automatically" and access your reports from a different time zone from where your physical support team is located, or if your computer (system) is set to a different time, the data in your reports will appear incorrect.
Reports overview
Reports help you keep track of ticket volumes, busy periods, response time, team and individual agent performance. Reports are accessible to all agents in your Helprace and can be called up by the Reports drop down menu at the top.
From there, you'll be able to select between a number of report types:
Tickets report
The Tickets report displays how ticket volume is carried across days and times. It shows what's being automated (triggers and automations), what macros and canned replies are most being used by agents.

Productivity report
The Productivity report analyzes how efficient your team is at reaching support goals. How much time and responses are needed to answer and solve tickets.
The productivity report consists of the following metrics:
- Response Time - how long users normally wait for an agent’s response.
- First Response Time - how long it takes for agents to respond to a user’s first message.
- Resolution Time - the average time it takes to solve a ticket.
- Replies to Solve - how many responses needed before a ticket is solved.

Happiness report
Shows an overview of all customer satisfaction ratings. See how many customers are satisfied with your support relative to the ones that aren't. You can also see satisfaction ratings for a specified period or preview individual tickets that scored good or bad.

Clicking on a ticket number will open full ticket thread for your review.
Note: You must enable satisfaction ratings to see the Happiness report.
Team report
Shows all reports according to a particular team or member. Zero in on how many users a particular agent has helped relative to the whole team. Look through the conversation and open up specific tickets without leaving the page.
Clicking on an agent at the bottom of the screen opens complete report on their ticket activity.

Using reports
Hover for more details
Not sure what a certain metric means? Not sure how something is calculated?

Hovering on a certain report metric or chart title will show a popup with a detailed description.

Custom dates
Click on the date at the top right of your report. You can set a preset or custom date range for your report next to Date Range. Selecting a preset e.g. Last Month / This Year or choosing a custom period will showcase data for that period.

Comparing date ranges
Compare your reports to a previous period or select a custom date range.
Tip: Previous period compares the same date range immediately before the date selected. For example, selecting Last Month will compare against the month before that, and selecting Last Year will compare against the year before that.

Selecting Compare Previous Period will show a gray graph on line charts showing data for the previous period. If there's any data to be compared, the tables will display a figure under Δ%, which indicates how certain metrics changed compared to the previous period.
If you select a pre-defined Date Range from the drop down, e.g. Last Month, a complete preceding month will be selected as previous period. E.g. if it's February (28 days), Previous Period will have entire January selected (31 days).
If you wish to compare equal number of days, select start and end dates in Date Range rather than a preset.
Business hours
Business hours are days and times for when your office is open. Configuring business hours is recommended for offices that don't operate 24/7. If the option is enabled, reports won't track performance when your office is closed. For example, if you're open between 9am - 5pm, a customer opens a ticket at 4am and an agent responds to it at 10am the next day, this ticket's first response time would be 1 hour. If business hours are disabled, it would be 6 hours instead.
Example without business hours configured:

The same data with business hours:

Business hours are disabled by default. Go to Settings > General > Business Hours to specify your office time zone and working hours. When you return to reports, the Business Hours option will be enabled.
Views
Views allow you to filter reports by inbox, tags, type, priority and channel. You can edit and save them any time. This keeps important metrics at your fingertips.
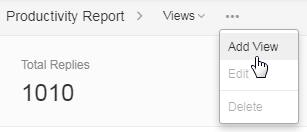
Add
- Click on the ••• button and select Add View.
- Give it a title.
- Select desired conditions. The view will include tickets that match all of the conditions (AND logic).
- Click Save.

Once you created a view, it will be selected automatically.
Select
If no views are selected, you'll see Views on the top left corner of your report. Click and select a desired view (if you have any available).

Select Clear to deselect the current view.
![]()
The last selected view is saved. If you revisit the reports page later, the last selected view will be pre-selected.
Edit
- Select the view you wish to edit.
- Click on the ••• button and select Edit.
- Make desired changes and click Save.
The view and reports will be updated immediately.
Delete
- Select the view you wish to delete.
- Click on ••• and select Delete.
Printing
Clicking the print icon in the upper right corner of your report opens your browser's printing preview dialogue. The printed version will include all data shown on the page including chars and lists.

Select the desired printing settings and click Print to go ahead.
Real time reports
Reports run in real-time. When you run a report, you're looking at the most current data.
Sharing reports
To share a report with a colleague who has access to your Helprace admin panel, simply copy-paste the URL from the browser address bar. The link includes all report settings you've selected: dates, view, etc. and your colleague will see what you see.
